On-Page SEO Infographic Guide: Visual Strategies to Boost Your Rankings
Last updated: December 2024
Introduction
Search engine optimization can feel overwhelmingly complex with its hundreds of ranking factors and constantly evolving algorithms. On-page SEO infographics cut through this complexity, distilling critical optimization strategies into visual formats that are easy to understand and implement.
This comprehensive guide explores on-page SEO through the lens of effective infographics, breaking down the elements that matter most for improving your search rankings and organic visibility. Create your own SEO infographics with tools like Ainfographic to communicate strategies clearly to your team or clients.
Table of Contents
Understanding On-Page SEO: The Foundation
On-page SEO encompasses all optimization efforts you can control directly on your website pages. Unlike off-page factors like backlinks that require external cooperation, on-page elements sit entirely within your control, making them the perfect starting point for SEO improvement.
The core principle behind on-page SEO is simple: help search engines understand your content's topic and value while simultaneously delivering excellent user experience. When you succeed at both, rankings improve naturally.
Infographics excel at teaching on-page SEO because the visual format mirrors how search engines process pages—looking at structure, hierarchy, relationships between elements, and overall organization. A well-designed SEO infographic shows these relationships in ways that text alone cannot.
Essential On-Page SEO Elements
Title Tags
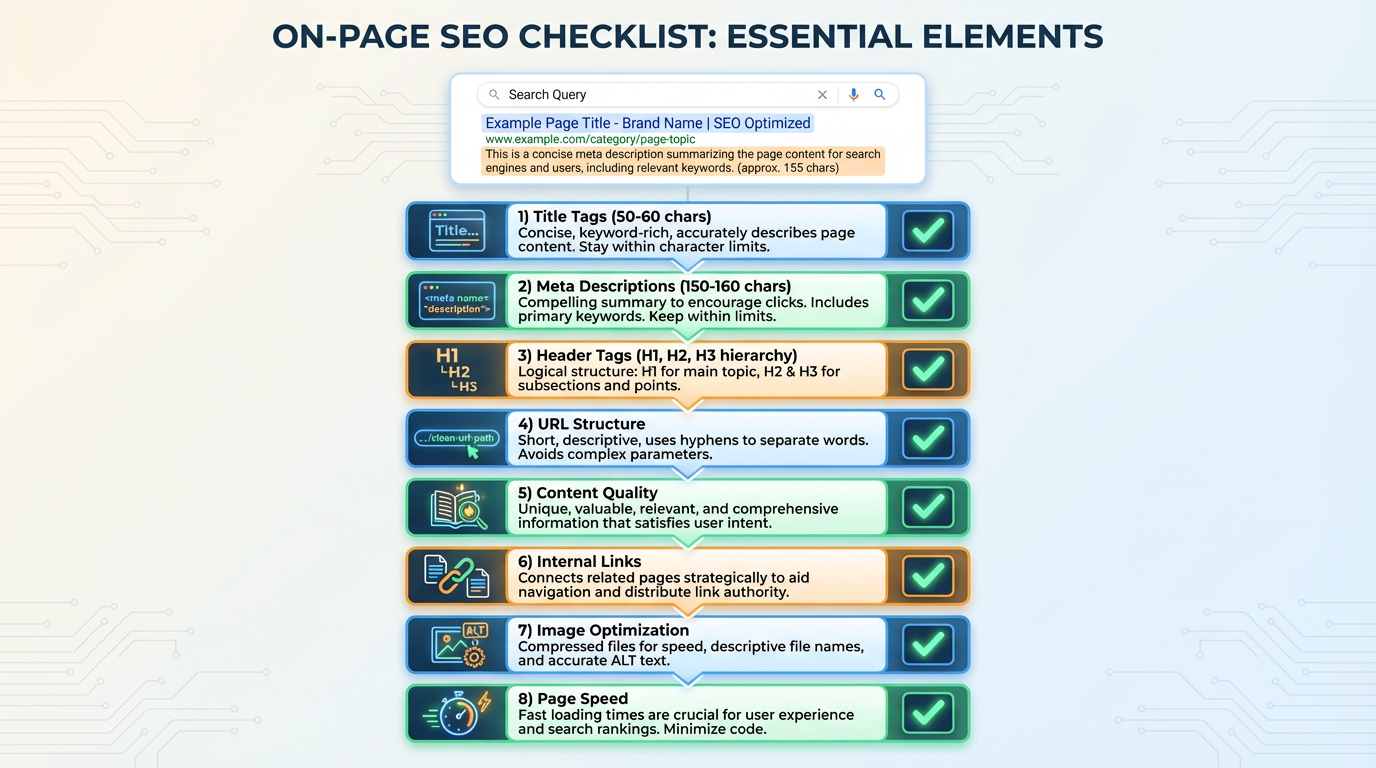
Title tags represent your page's headline in search results and browser tabs. Infographics typically illustrate ideal title tag construction: primary keyword near the beginning, compelling benefit or value proposition, brand name at the end when space permits, and optimal length of 50-60 characters.
Meta Descriptions
Meta descriptions don't directly impact rankings but significantly affect click-through rates. Effective SEO infographics show how to craft compelling meta descriptions: include target keywords naturally, provide clear page summaries that entice clicks, incorporate calls-to-action when appropriate, and stay within 150-160 characters.
Header Tags (H1, H2, H3)
Header tags create content hierarchy that both users and search engines rely on. Infographics illustrate proper header structure: one H1 per page containing the primary keyword, H2s breaking content into major sections, H3s and below for subsections, creating a logical content outline.
URL Structure
URL structure matters more than many realize. Clean, descriptive URLs outperform messy parameter-filled strings. Infographics demonstrate ideal URL construction: short and descriptive, include target keywords, use hyphens rather than underscores, avoid unnecessary parameters and session IDs.
Content Quality and Depth
Content quality and depth cannot be overlooked. Infographics emphasize comprehensive coverage of topics, incorporating relevant keywords naturally, matching search intent, providing genuine value beyond keyword stuffing, and maintaining readability with short paragraphs and varied sentence structure.
Internal Linking
Internal linking creates a web of connections within your site. Effective infographics show how internal links distribute page authority, help search engines discover content, guide users to related information, and use descriptive anchor text that provides context.
Image Optimization
Image optimization encompasses multiple elements. Visual guides typically cover: descriptive file names including keywords, properly formatted alt text describing images for accessibility and SEO, appropriate file sizes for fast loading, modern file formats like WebP when possible, and responsive images that adapt to different screen sizes.
Page Speed
Page speed directly impacts both user experience and rankings. Infographics highlight speed optimization: minimize HTTP requests, compress images aggressively, leverage browser caching, minify CSS and JavaScript, and consider content delivery networks for global audiences.
On-Page vs Off-Page SEO Infographic Breakdown
Understanding the distinction between on-page and off-page SEO is crucial for developing comprehensive strategies. Infographics excel at visualizing these differences.
On-Page Factors (Within Your Control)
- Content quality and optimization
- Technical elements like site speed and mobile responsiveness
- User experience factors including navigation and design
- Internal linking structure
Off-Page Factors (External Cooperation Required)
- Backlinks from other sites representing votes of confidence
- Social signals and brand mentions across the web
- Review site presence and ratings
- Overall brand authority and online reputation
The relationship between these categories appears complex in text but becomes clear in infographic form. Visual representations show how on-page optimization creates the foundation that makes off-page efforts more effective, while off-page signals validate and amplify your on-page work.
Visualize Your SEO Strategy
Create professional SEO infographics with Ainfographic to explain complex optimization concepts to your team or clients. Turn data into compelling visual stories.
On-Page SEO Checklist Infographic Elements
Comprehensive on-page SEO checklist infographics typically organize tasks into logical categories, making the optimization process less overwhelming.
Keyword Research and Planning
- Identify target keywords with search volume and competition analysis
- Map keywords to specific pages avoiding cannibalization
- Understand user search intent behind each keyword
- Identify long-tail variations for comprehensive coverage
- Analyze competitor keyword strategies for opportunities
Content Creation and Optimization
- Develop comprehensive content addressing user needs
- Incorporate target keywords naturally in content
- Use semantic keywords and related terms
- Structure content with clear headers
- Optimize opening paragraphs to immediately address search intent
- Include multimedia elements enhancing engagement
Technical On-Page Elements
- Craft compelling, keyword-optimized title tags
- Write persuasive meta descriptions driving clicks
- Create logical header tag hierarchies
- Optimize URLs for clarity and keywords
- Implement schema markup providing rich snippet opportunities
- Ensure mobile responsiveness across devices
- Optimize page load speed ruthlessly
User Experience Factors
- Design intuitive navigation making content easy to find
- Ensure readability with appropriate fonts and spacing
- Create compelling calls-to-action guiding user journeys
- Implement internal linking helping users discover related content
- Optimize for accessibility ensuring everyone can use your site
Measurement and Analysis
- Set up proper analytics tracking
- Monitor keyword rankings over time
- Track organic traffic patterns and trends
- Analyze user behavior metrics like bounce rate and time on page
- Identify underperforming pages needing improvement
Creating Effective SEO Infographics
SEO infographics themselves represent powerful content marketing and link-building tools when created effectively.
Design Principles
Design principles matter significantly. Effective SEO infographics employ clear visual hierarchy directing viewer attention, use consistent color schemes reinforcing brand identity, incorporate plenty of white space preventing overwhelming density, choose readable fonts appropriate for digital viewing, and maintain logical flow guiding viewers through information progressively.
Content Structure
Content structure in successful SEO infographics follows patterns: begin with an attention-grabbing headline, provide context establishing why the information matters, break complex information into digestible chunks, use icons and illustrations clarifying concepts, include specific, actionable takeaways, and end with clear calls-to-action.
Optimization for Sharing
- Creating multiple size versions for different platforms
- Adding social sharing buttons prominently
- Including embed codes encouraging republishing with attribution
- Optimizing file sizes for fast loading without quality loss
- Designing mobile-friendly versions since most social sharing happens on mobile
Creating with Ainfographic
Tools like Ainfographic make it easy to create professional SEO infographics without design experience. Simply input your data, choose a template, and customize colors and layouts to match your brand.
Advanced On-Page SEO Techniques Worth Visualizing
Schema Markup Implementation
Schema markup implementation provides search engines with structured data about your content. Infographics can visualize different schema types: Article schema for blog posts and news content, Product schema for e-commerce pages, FAQ schema for question-answer content, and Review schema for content including ratings.
Content Clustering and Topic Authority
Content clustering and topic authority building creates interconnected content groups. Visual representations show how pillar pages cover broad topics comprehensively while cluster content addresses specific subtopics, with strategic internal linking creating semantic relationships that signal topical authority to search engines.
Featured Snippet Optimization
Featured snippet optimization targets position zero in search results. Infographics can demonstrate: how to identify snippet opportunities through keyword research, content formatting that matches common snippet types like lists and tables, and structure that directly answers common questions.
Core Web Vitals Optimization
Core Web Vitals optimization focuses on specific user experience metrics Google uses for ranking. Visual guides help webmasters understand: Largest Contentful Paint measuring loading performance, First Input Delay assessing interactivity, and Cumulative Layout Shift evaluating visual stability.
Common On-Page SEO Mistakes Illustrated
Keyword Stuffing
Keyword stuffing remains common despite being counterproductive. Comparison infographics show natural keyword usage versus forced, awkward repetition, illustrating why the latter hurts both user experience and rankings.
Thin Content
Thin content that fails to adequately address topics appears obviously insufficient when visualized against comprehensive alternatives. Side-by-side comparisons make the depth difference immediately apparent.
Poor Mobile Optimization
Poor mobile optimization becomes crystal clear through before-and-after visual examples, showing how mobile-friendly design impacts user experience and search rankings.
Slow Page Speed
Slow page speed effects can be demonstrated through infographics showing user abandonment patterns and how even small speed improvements significantly impact engagement metrics.
Broken Internal Links
Broken internal links and poor site structure create maze-like experiences. Network diagrams visualize how good structure facilitates exploration while poor structure creates dead ends and frustration.
Measuring On-Page SEO Success
Infographics help visualize the metrics that matter for evaluating on-page optimization effectiveness.
Organic Traffic Growth
Organic traffic growth represents the ultimate goal. Trend charts showing traffic increases following optimization clearly demonstrate ROI and justify continued SEO investment.
Keyword Ranking Improvements
Keyword ranking improvements track progress for target search terms. Position tracking visualizations show ranking trajectories over time, highlighting which optimizations drive the biggest improvements.
Engagement Metrics
Engagement metrics reveal whether improved rankings translate to satisfied users. Infographics displaying bounce rate reductions, time-on-page increases, and pages-per-session improvements confirm that optimizations enhance user experience alongside search visibility.
Conversion Rate Tracking
Conversion rate tracking ensures SEO efforts drive business results. Visualization of how organic traffic conversions compare to other channels demonstrates SEO's business value beyond vanity metrics.
Conclusion
On-page SEO infographics transform complex optimization concepts into accessible, actionable visual guides. By distilling essential ranking factors, best practices, and common mistakes into visual formats, these infographics help marketers and website owners improve their search visibility more effectively than text-based guides alone.
Whether you're creating infographics to explain SEO to clients, educating your team, or building shareable content for link acquisition, understanding both on-page SEO fundamentals and effective infographic design principles positions you for success. Start applying these visual strategies today and watch your organic search performance improve systematically.
Create Your SEO Infographic
Design professional SEO infographics, flowcharts, and visual guides with Ainfographic. Make complex SEO concepts easy to understand.
Start Creating Infographics